|
|
|
iPBORE is the light and mobile version of PBORE-3D, targeting mobile digital platforms such as iPhones, iPads, smartphones, and tablets.
Introduction
iPBORE is a user-friendly software that analyzes and simulates the time-dependent effects on wellbore stability while drilling. The software is structured to assist drilling engineers to design a wellbore drilling program for mudweight window, mud salinity, and depth-gradient analyses. With the efficiency and accuracy of iPBORE, drilling engineers can perform a wide variety of computations and generate results in a very short time, which renders iPBORE a unique tool to simulate “real-time” analysis. iPBORE also has a graphical user interface that includes features like routines for data editing, data validation, and graphical presentation of results, and is supplemented with a convenient online help utility. Results generated using iPBORE can be exported to other applications, e.g., Microsoft Word©.
Capabilities
iPBORE
includes the conventional elastic wellbore stability modeling.
The wellbore can be modeled with either the permeable or impermeable wall condition.
Results can be generated for a number of scenarios such as:
- Failure analysis to evaluate critical mudweight for fracturing and collapse conditions.
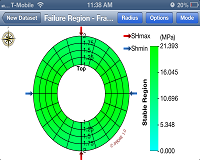
- Estimate critical regions near wellbore under a specified mudweight to visualize regions prone to failure.
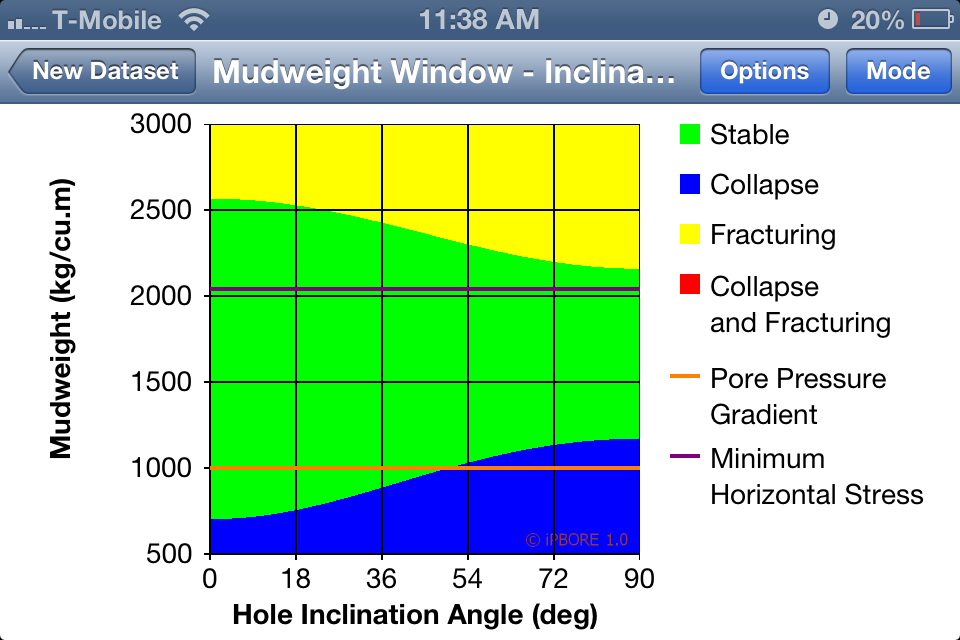
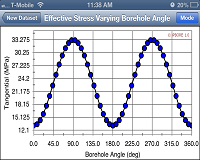
- Calculate the safe mudweight window as a function of hole inclination or azimuth.
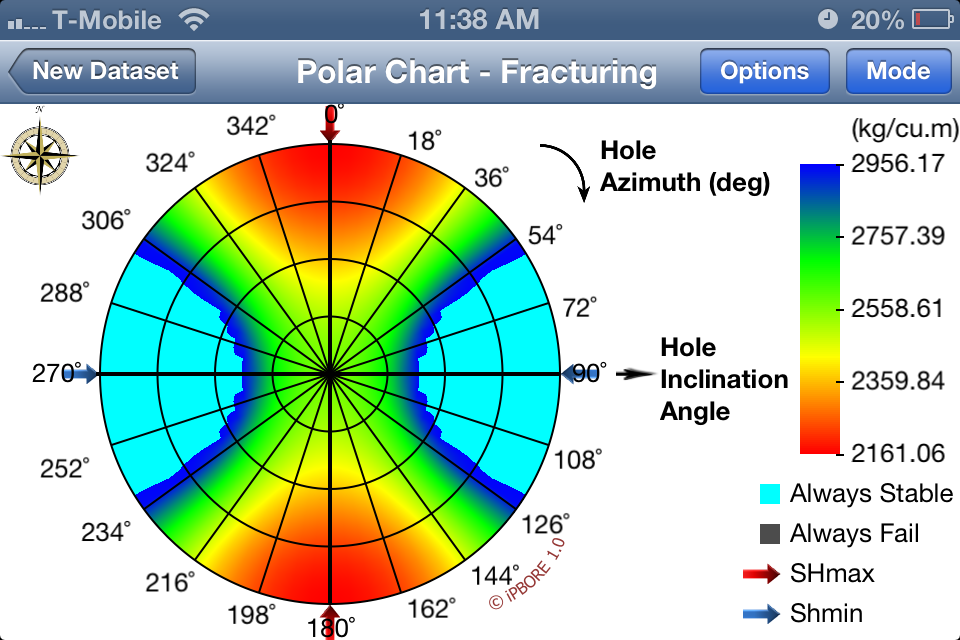
- Optimize for directional drilling by generating polar charts to evaluate critical mudweights for the entire range of hole inclination and azimuth.
Polar Charts |
Mud
window |
|
|
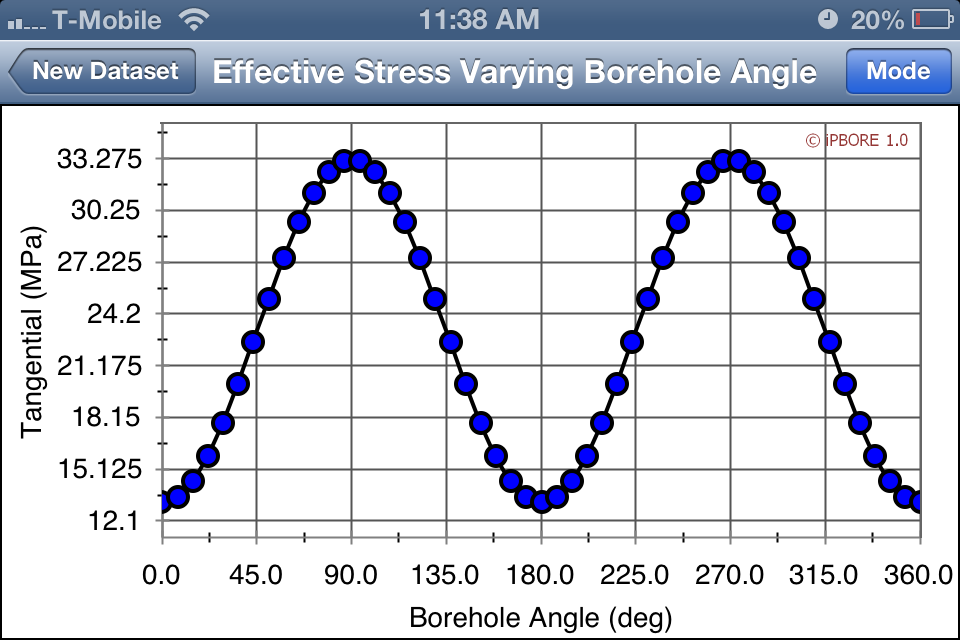
2D
Plot |
Failure region |
 |
 |
(Click
images for enlarged view) |
| |
|
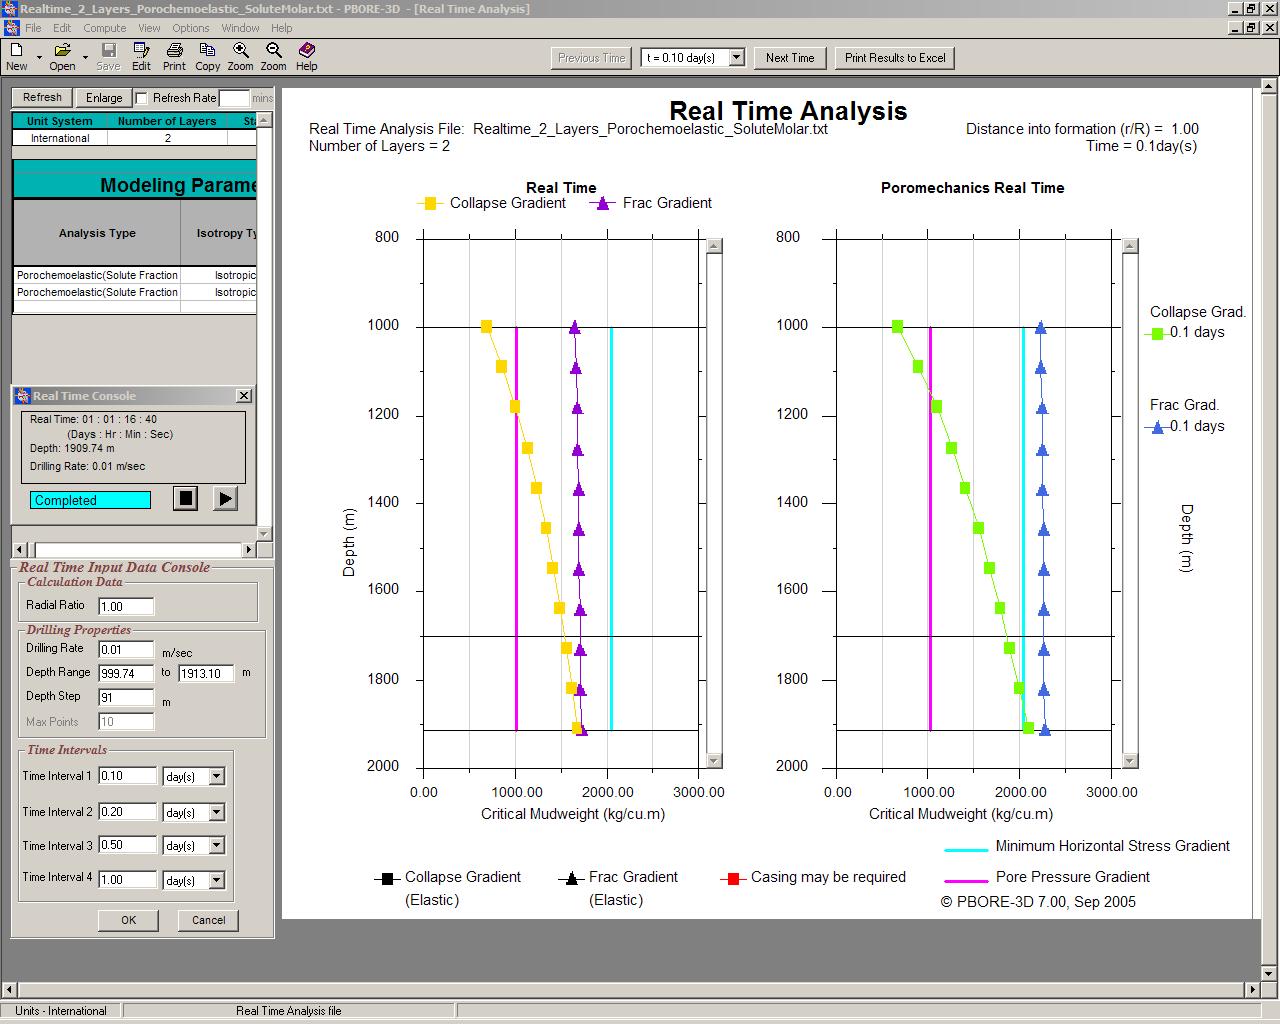
PBORE-3D is becoming the industry standard for real-time wellbore analysis and design. This software applies the coupled fluid flow and rock deformation analyses in the studies of wellbore stability and drilling mud design.
Introduction
PBORE-3D is a user-friendly software that analyzes and simulates the time-dependent effects on wellbore stability while drilling. The software is structured to assist drilling engineers to design a wellbore drilling program for mudweight window, mud salinity, and depth-gradient analyses. With the efficiency and accuracy of PBORE-3D, drilling engineers can perform a wide variety of computations and generate results in a very short time, which renders PBORE-3D a unique tool to simulate “real-time” analysis. PBORE-3D also has a graphical user interface that includes features like routines for data editing, data validation, and graphical presentation of results, and is supplemented with a convenient online help utility. Results generated using PBORE-3D can be exported to other applications, e.g., Microsoft Word©.
Capabilities
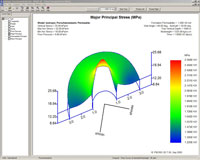
PBORE-3D
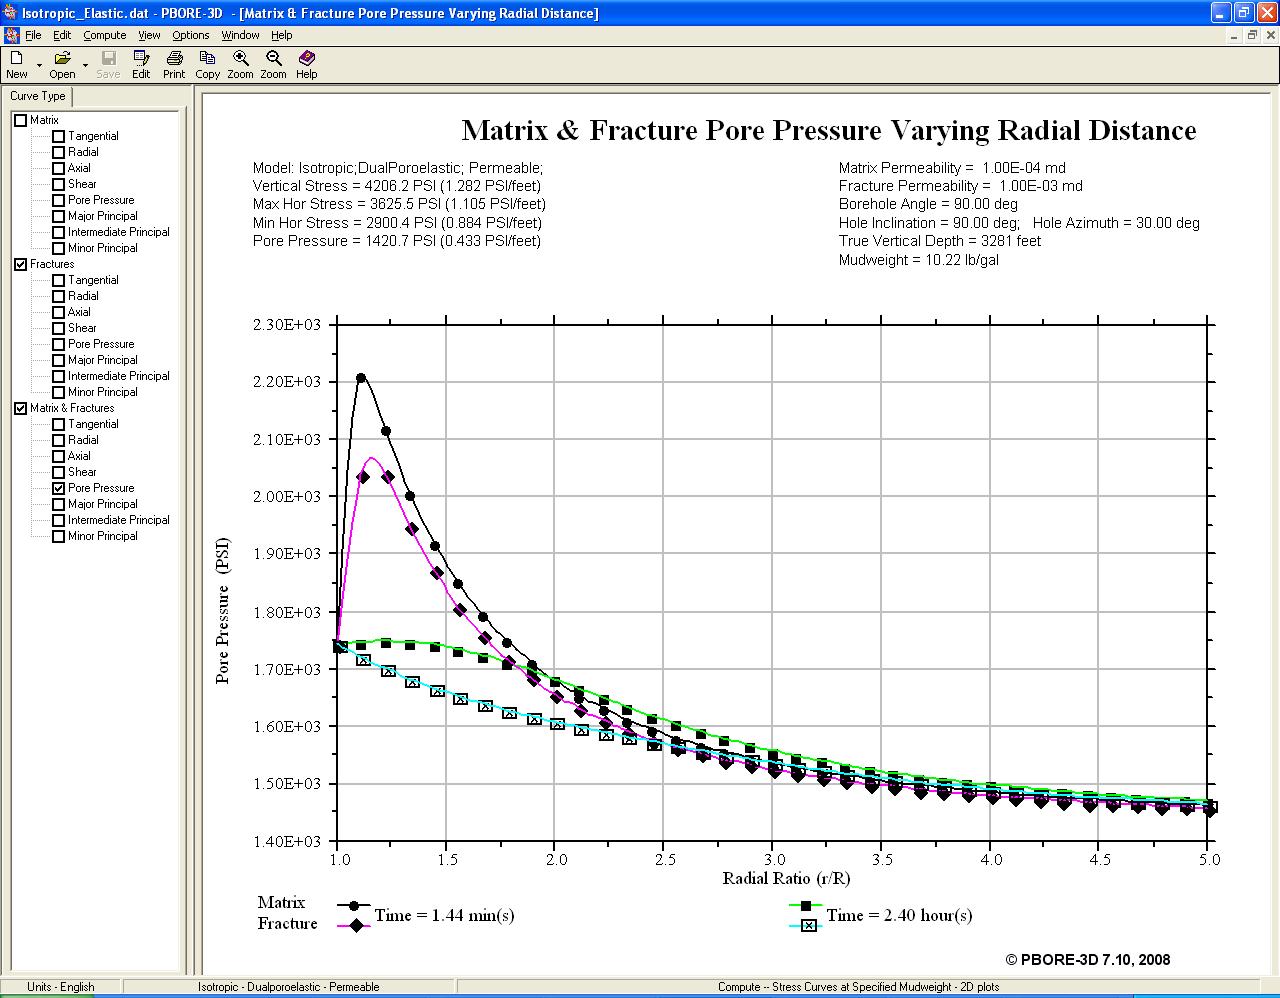
is the only existing software package that includes the poromechanics
models, which account for the time-dependent effects of the pore
pressure diffusion coupled with chemical and thermal effects. Also
included in PBORE-3D are the elastic models. The wellbore can be
modeled with the above models for both the isotropic as well as
transversely isotropic formation types with both the permeable and
impermeable wall conditions. Results can be generated for a number
of scenarios such as follows:
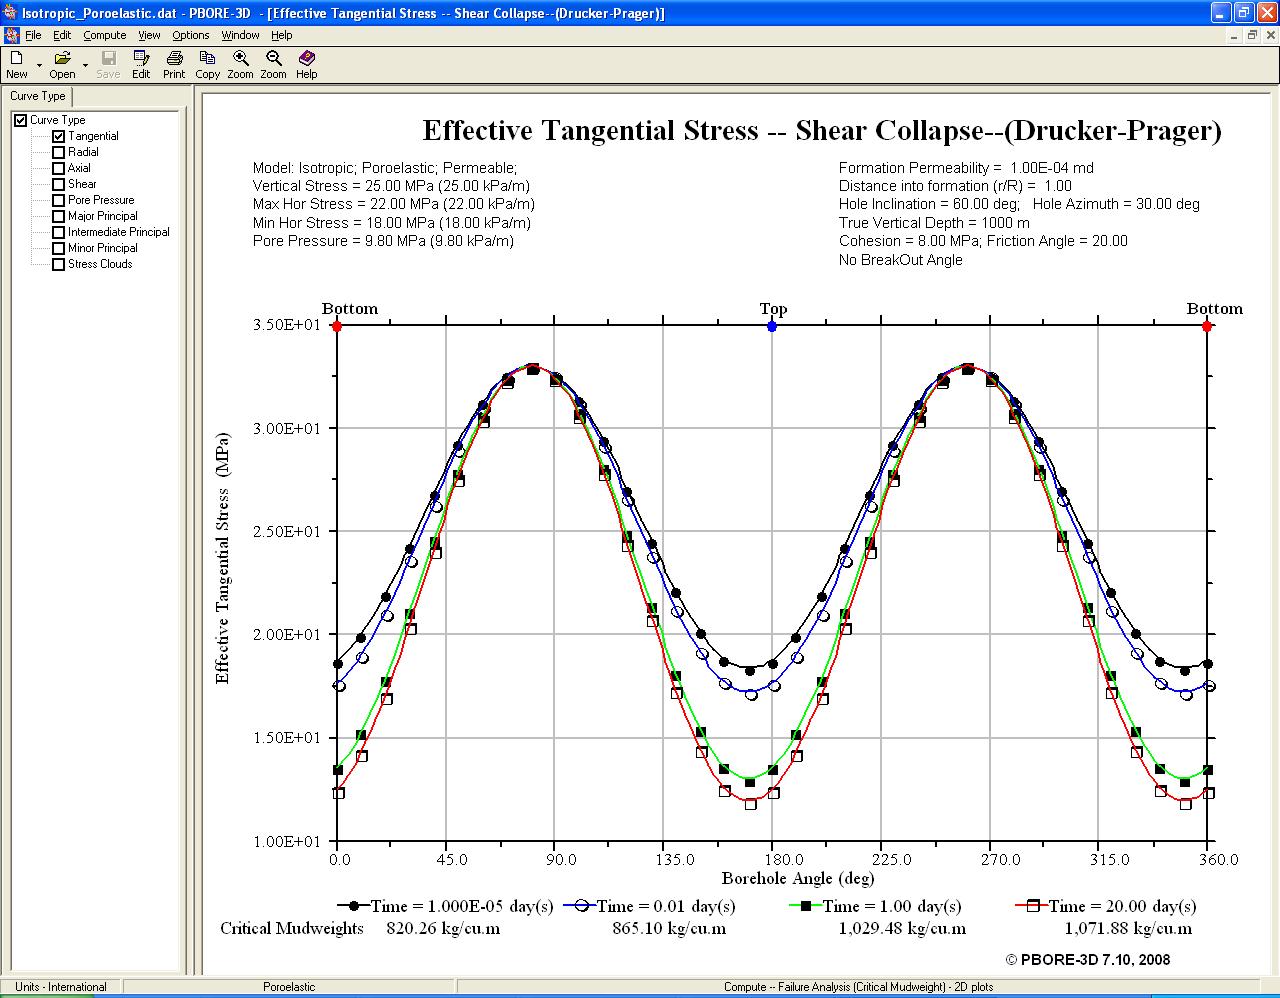
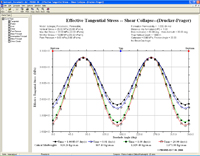
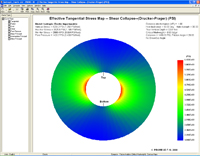
- Failure analysis to evaluate critical mud weights for fracturing,
collapse, and spalling conditions.
- Estimate critical regions near wellbore under a specified mud weight to view
regions prone to failure.
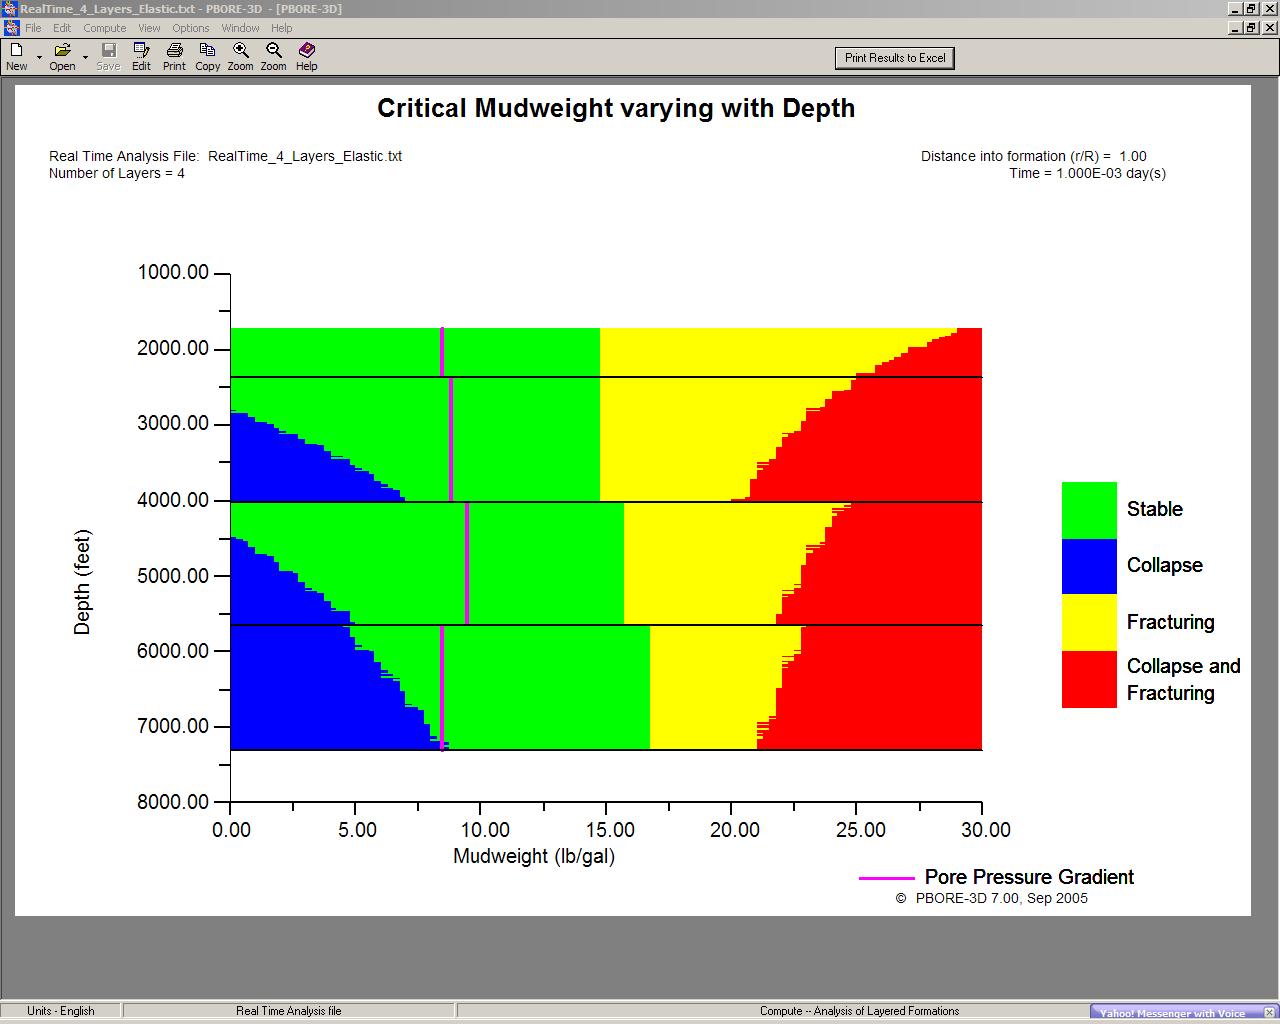
- Calculate
and view the time-dependent safe mud window as a function of the
hole angle, azimuth and depth.
- Optimize
for directional drilling by generating time-dependent polar charts
and maps to evaluate the critical mud weights for the entire range
of hole angles and azimuth.
- Analyze
layered formations and generate safe time-dependent mud window for
different sections in the stratigraphy.
PBORE-3D has been used and tested under real-time drilling
conditions and is proven to generate results valuable to help drilling
engineers make critical decisions. Field Validation PBORE-3D has
been used to analyze borehole stability problems in the field and
has been validated. One example is a well in the North Sea. PBORE-3D
results predicted an equivalent mud weight of 11.7 ppg to ensure
the time-dependent safe mud window. Subsequently, drilling operations
were successfully completed to target depth with a quasi-static
mud weight of 12 ppg. A detailed description of the field case study
has been published in the February 2001 issue of the Journal of
Petroleum Technology.
Features
- Time-dependent wellbore stability analysis
- Failure analysis
to calculate critical mudweight
- Estimate safe mud window
- Chemical analysis.
- Directional drilling with polar charts.
- Analysis for layered formations.
- Conventional Elastic models.
- Poromechanical models.
- Real-time analysis.
- Isotropic & transversely isotropic formations.
- Tested under real-time drilling conditions.
- User-friendly and robust.
Polar Charts |
Mud
window |
|
|
2D
Plot |
3D
Plot |
 |
 |
Contour Maps |
Fractures Rock Analyses |
 |
 |
|
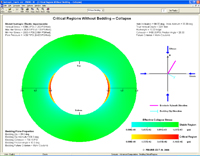
Without Bedding Plane |
With Bedding Plane |
|
 |
 |
| At
Real time |
|
(Click
images for enlarged view) |
|
| |

|
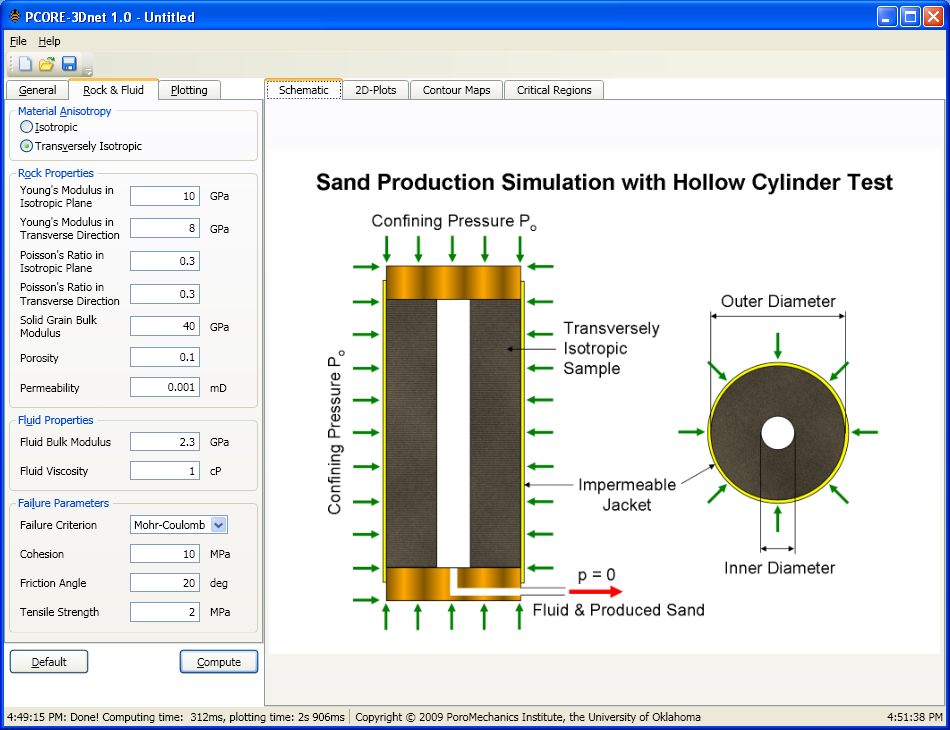
Introduction
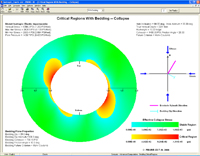
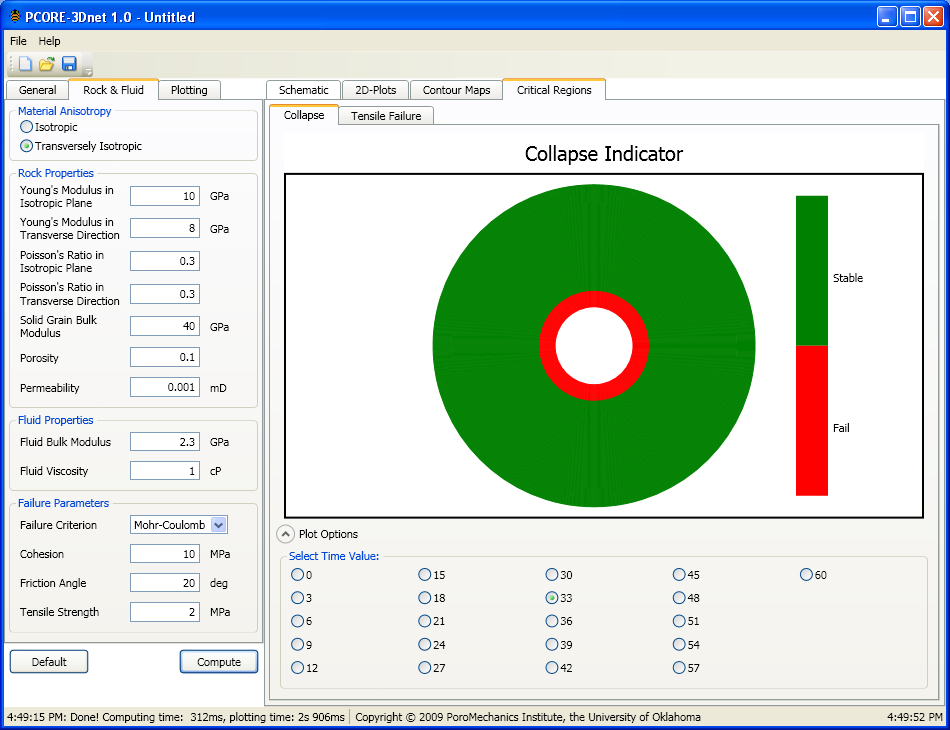
PCORE-3Dnet simulates time-dependent responses of thick wall
cylinder samples in a variety of testing configurations and with
different rock types. In addition, the tool helps tuning the testing
frame and pinpointing anomalies in the actual testing results. The software
utilizes analytical solutions within both the poromechanics and
the solid mechanics approaches for the thick wall cylinder geometry.
|
Capabilities
- Reduce the
total number of cores needed for testing.
- Extend the
range of measurable parameters by extrapolating the laboratory test
results.
- Project outcomes
on rock/soil behavior for prematurely failed test runs.
- Pinpoint causes
of anomalies in actual test results.
- Predict the
ultimate strength of the test subject and optimize the test run.
- Tune test
frames and narrow the margin-of-setting of test parameters.
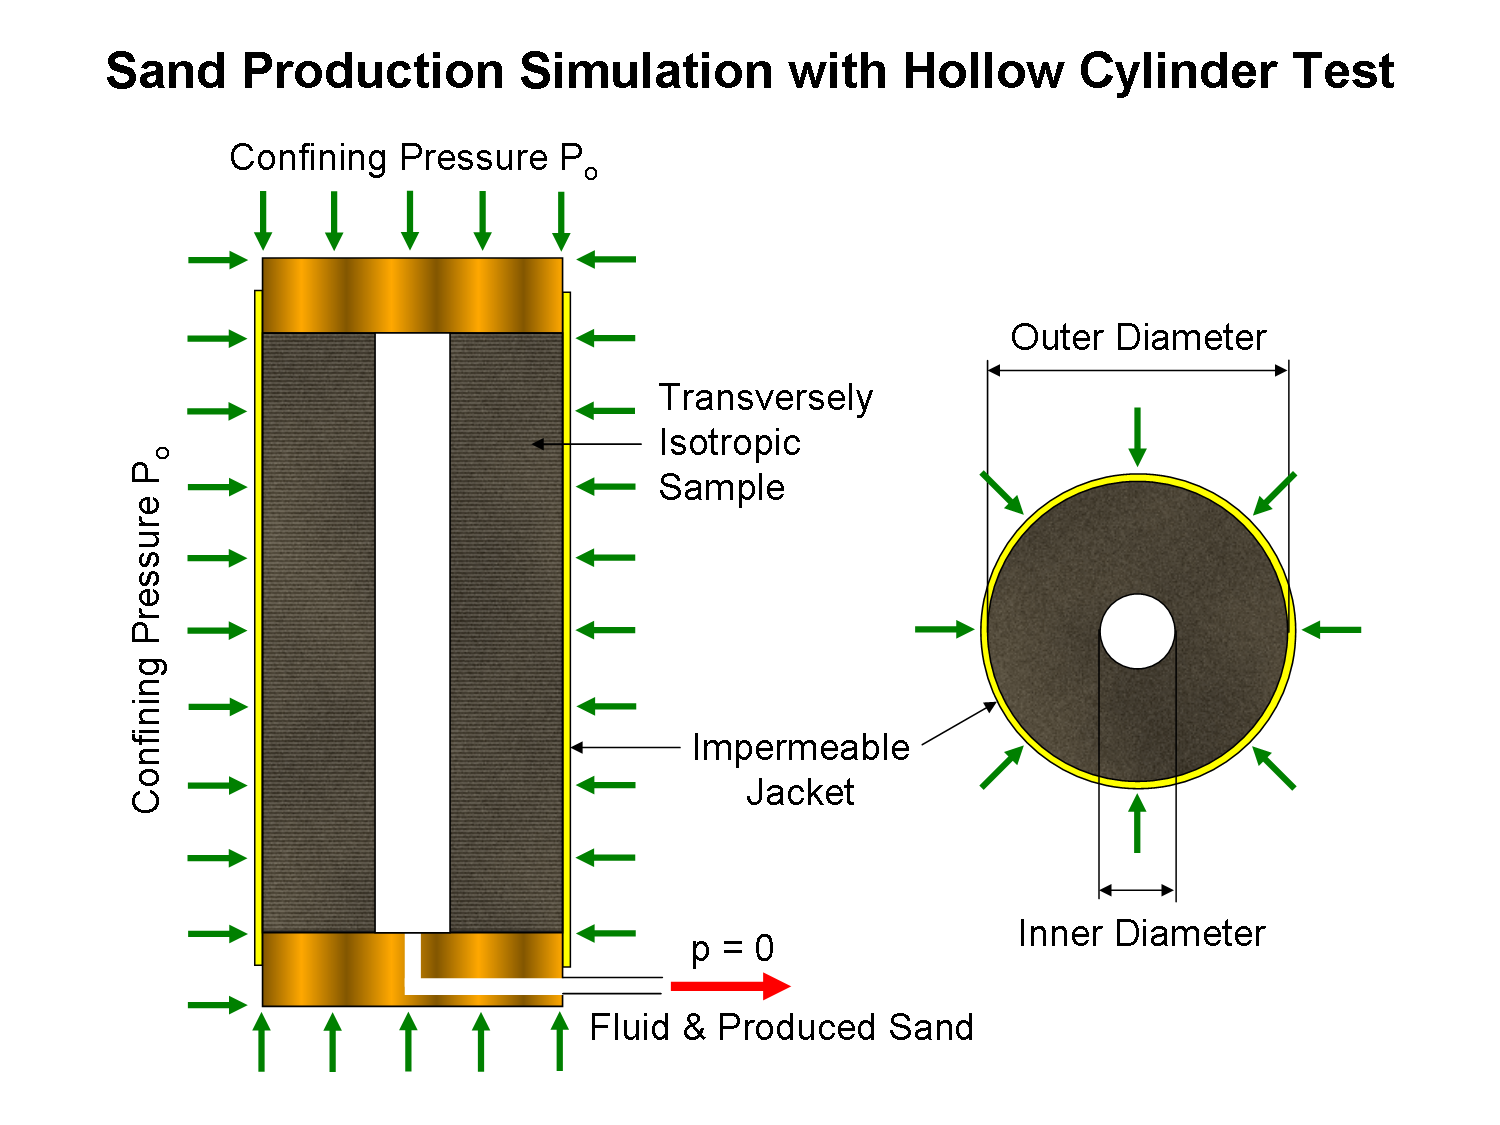
- Simulate thick-wall
cylinder testing and provide better understanding of the potentials
of sanding.
- Project the
transient responses of low permeability rocks such as shale.
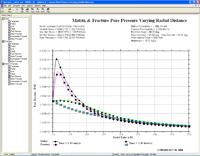
Problem
Geometry |
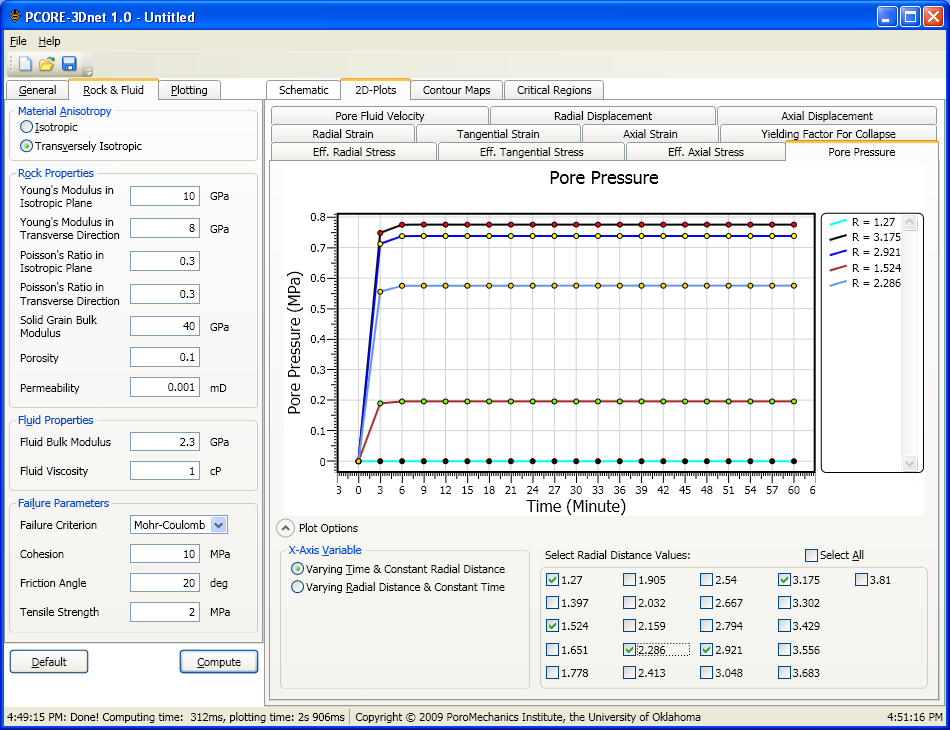
2D
Plot |
 |
 |
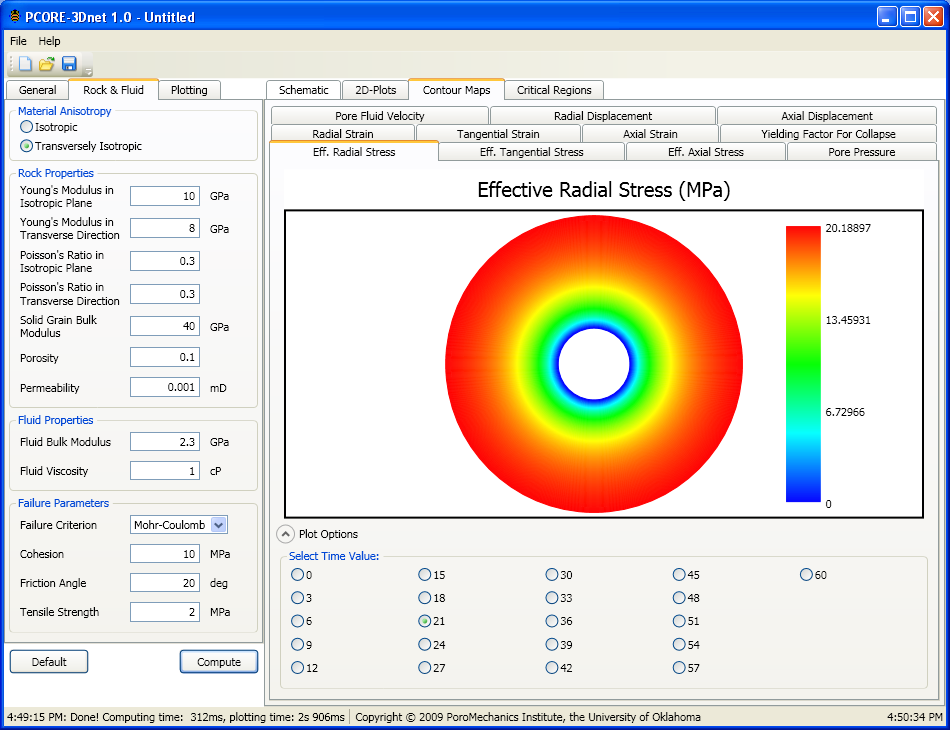
Contour Map |
Critical Region Map |
|
 |
| |
(Click
images for enlarged view) |
|
| |
|
Introduction
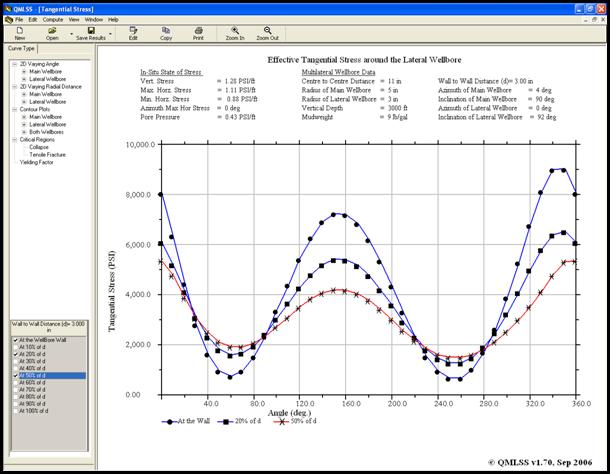
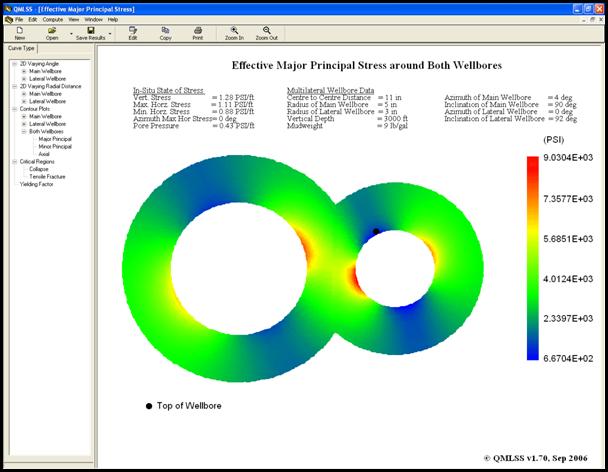
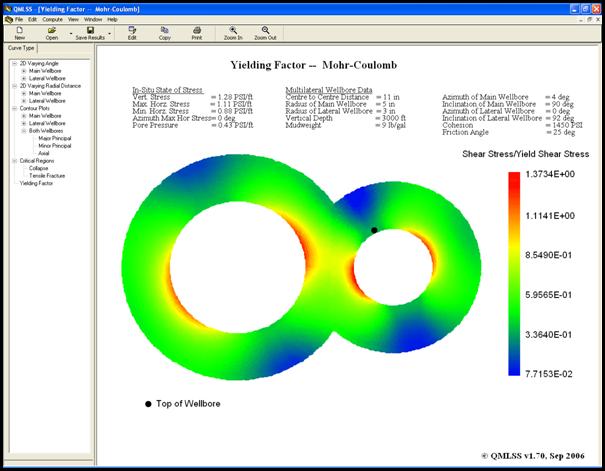
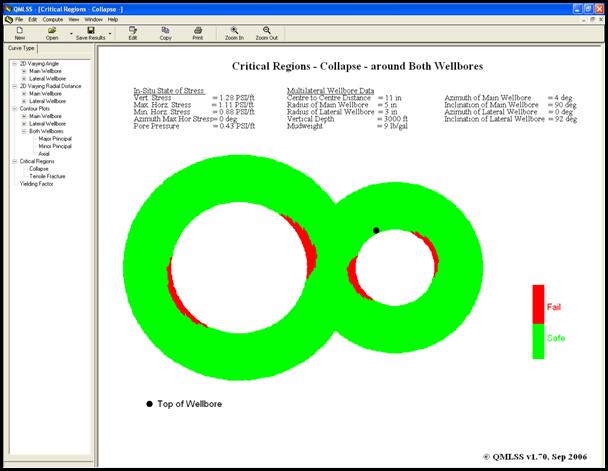
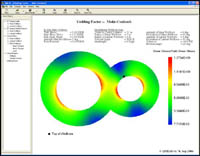
QMLSS is a stress-based physical and mathematical simulator for the analysis, design, and planning of multilaterals based on the classical theory of elasticity while adhering to the industry engineering practice and field applications. QMLSS can help analyze and predict wellbore and junction stability during drilling and extended openhole completion as well as during production in terms of formation pore pressure depletion. The tool can also assist the optimization of junction placement in terms of formation properties and wellbore trajectories.
The analytical solution implemented in QMLSS has been validated with laboratory experiments previously conducted by Schlumberger, Total, etc. with excellent qualitative and quantitative agreement (SPE 90245, SPE 116138). QMLSS has also been used successfully to analyze not only wellbore stability during drilling but also sustainable openhole production and pressure management for a Khuff-C multilateral drilled and owned by Saudi Aramco in the Ghawar field (SPE 116138). This analytical simulator is now used to calibrate finite element studies on multilateral stability in terms of mesh space, element density, etc. For example, it has been found that the commercially available code ABAQUS requires about 70,000 elements to obtain an average of 1% error on effective stress calculation.
|
|
Capabilities
Results in QMLSS can be generated for a number of scenarios such as follows:
- Evaluation of the stress distribution in and around the multilateral junction subjected to a 3-D stress state
with mudweight pressure at the wellbore walls. The results can be displayed in various forms, 2-D plots as
well as contour plots.
- Failure analysis to evaluate critical
collapse mudweight for a given stress state and junction geometry, with the option of including breakout angle, for one section or multiple sections of the multilateral.
- Estimate critical regions prone to
failure around the junction under specified mudweight.
2D Plot
|
Contour Plot
|
|
|
Yielding Factor
|
Critical
Region |
 |
|
(Click
images for enlarged view) |
|
| |
|
Introduction
Wellbore
stability of multilateral junctions is increasingly becoming a major
concern for the oil and gas industry.
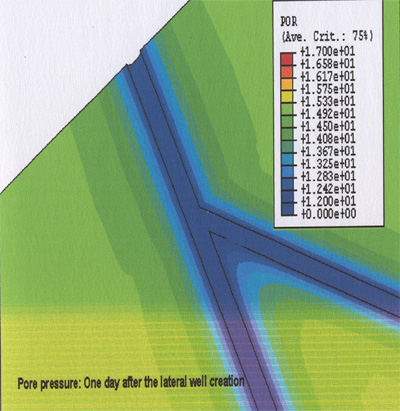
The evaluation of stress and pore pressure redistributions due to
the excavation of a lateral wellbore from a main wellbore is important
in evaluating the stability of the junction. The objective of the
analysis is to evaluate the stress conditions at the multilateral
wellbore with a three-dimensional geometric configuration and porous
medium using the poroelastoplasticity.
|
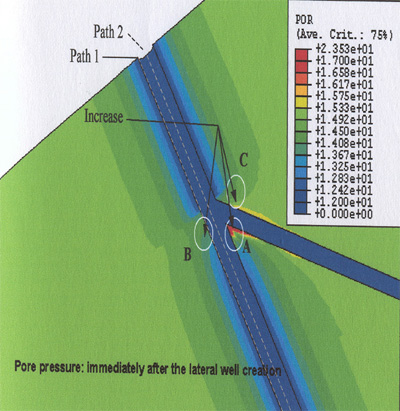
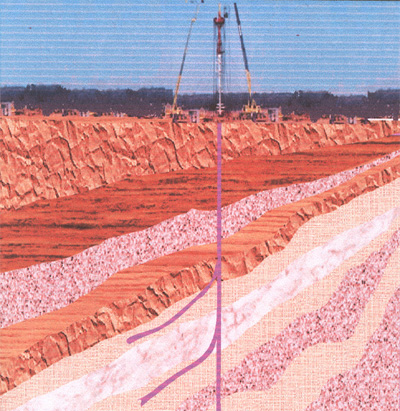
Finite Element Modeling of Inversion Tectonics: Application to the Elgin & Franklin Fields, Central North Sea
The primary goals were to generate
realistic two-dimensional models of the stress/strain history and
likely locations of secondary faulting during extension and subsequent
inversion of a listric fault, and to include effects from syn-tectonic
deposition and subsidence.
Focus
not on producing exact match to Elgin & Franklin fields,
rather provide reasonable simulation of general geologic
& tectonic setting.
Schematic Diagram |
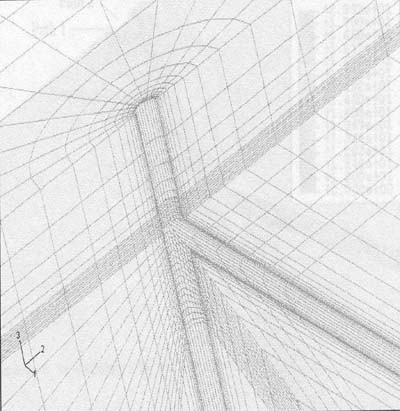
Finite Element Mesh |
 |
 |
Pore Pressure Immediately after Lateral Well Creation |
Pore Pressure one day after Lateral Well Creation |
|
 |
| |
|
| |
|
|
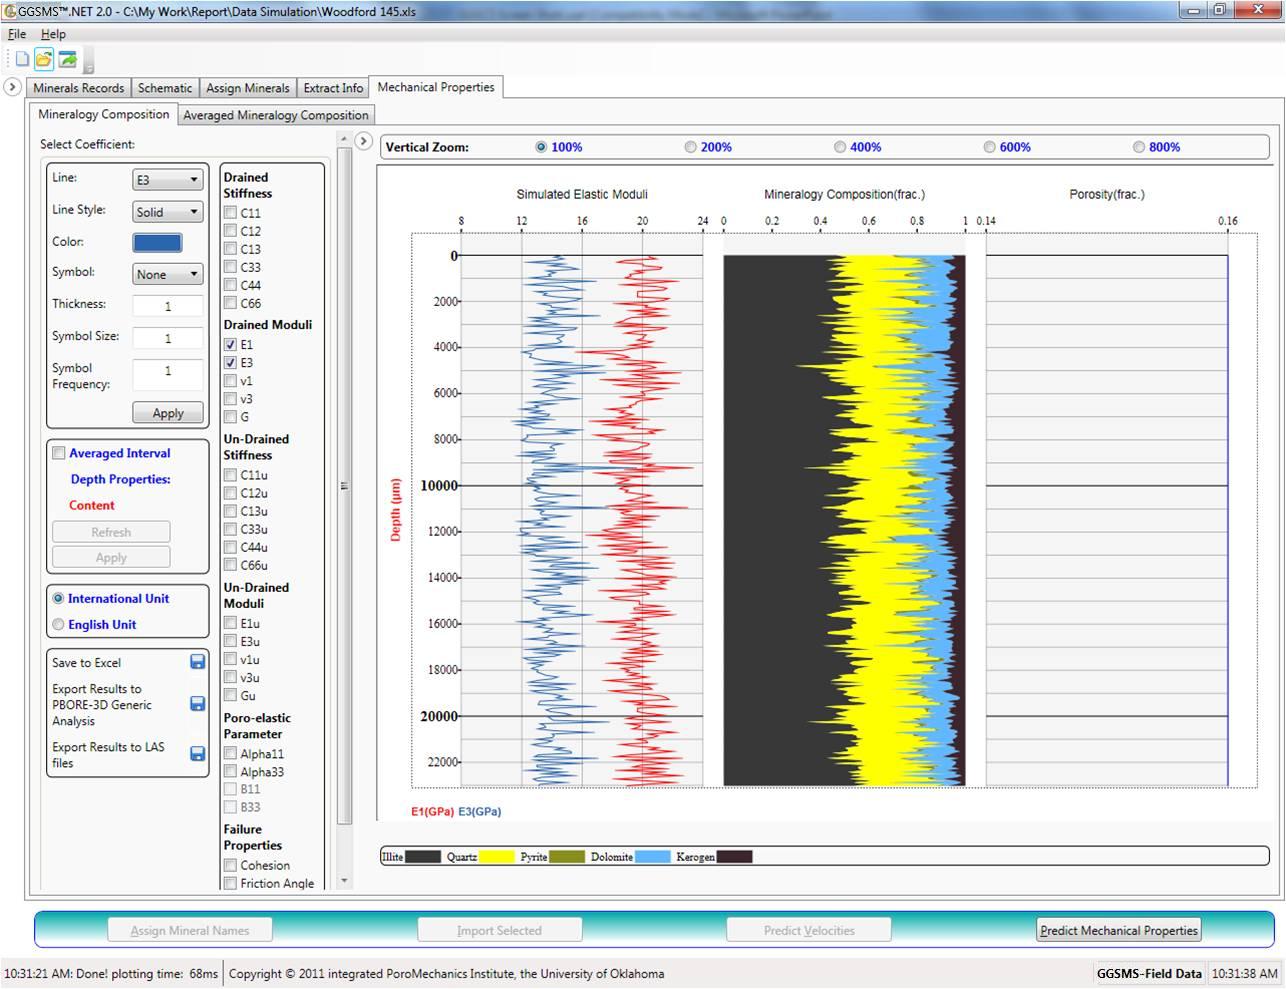
Introduction
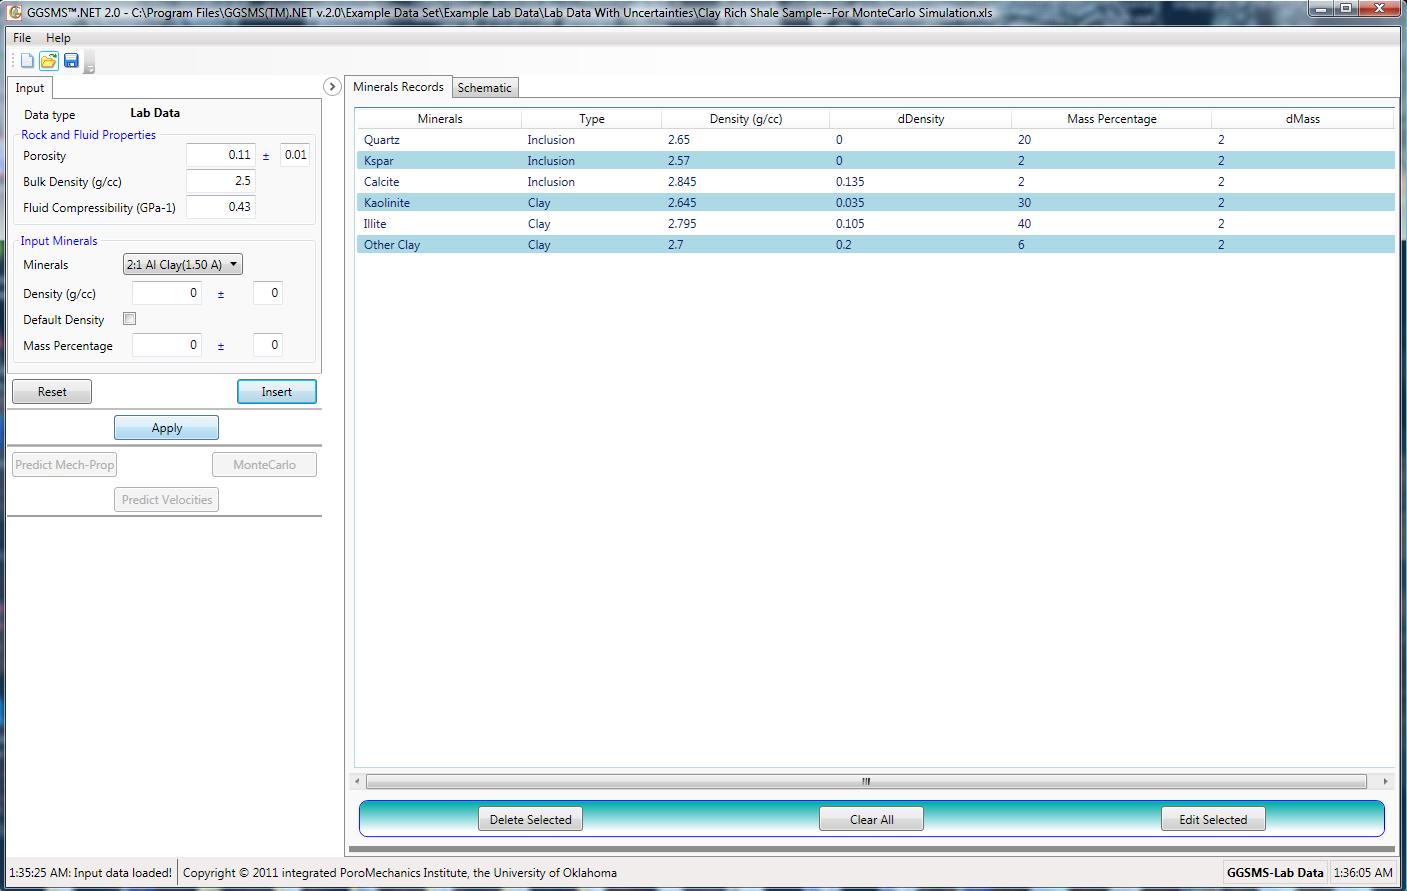
Shale, with its inherent heterogeneity and anisotropy, has always been problematic in many operations ranging from seismic exploration, well-log data interpretation, well drilling and well-bore stability problems, to production. An ongoing industry-academia partnership has been formed to conduct a study aiming at bridging the gap between invariant characteristics at nano scale of sedimentary rocks and their macroscopic properties.
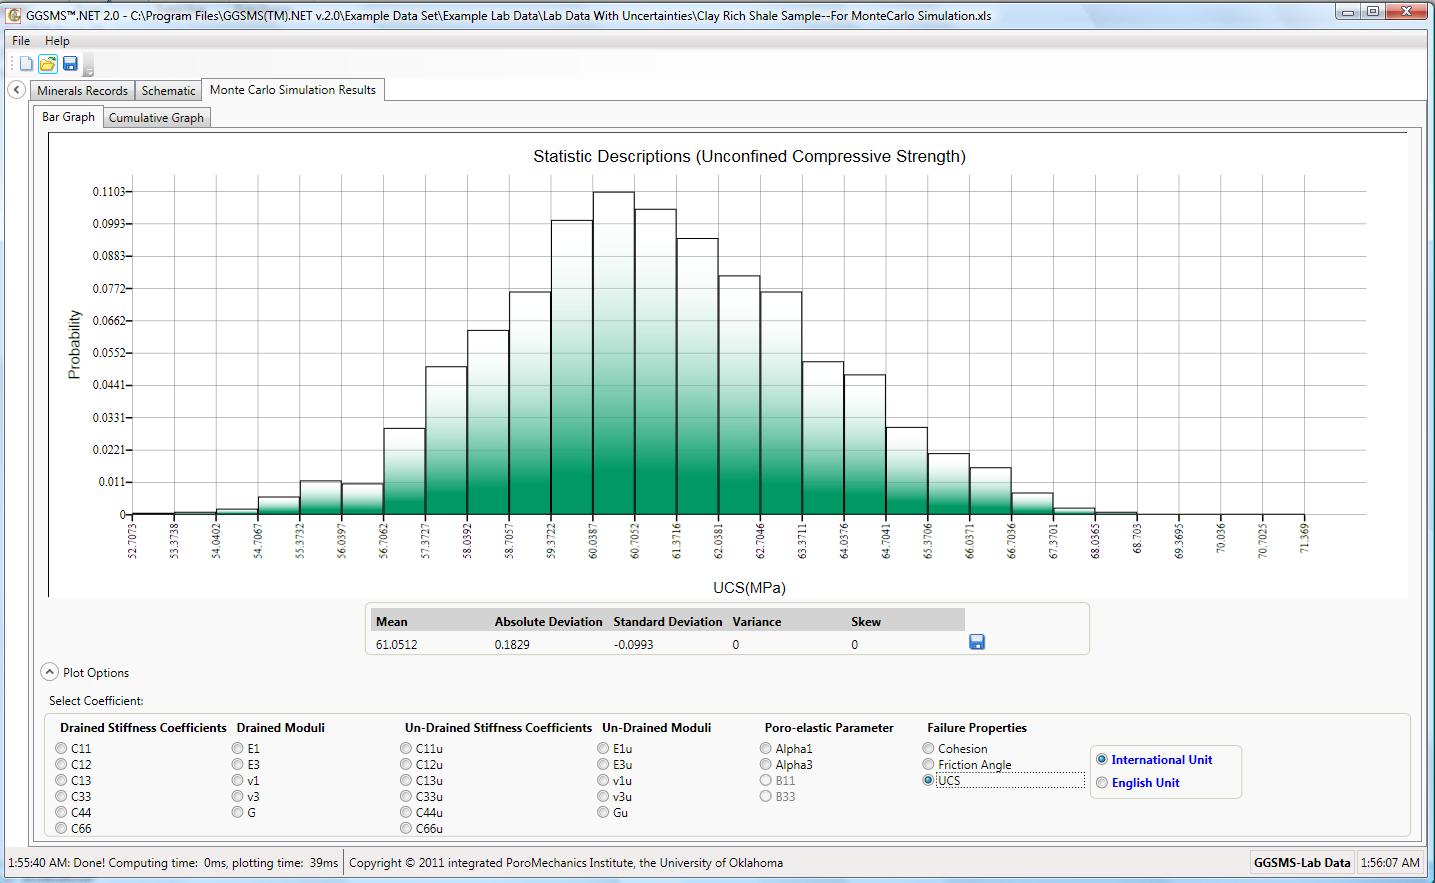
The results of this study have been implemented in a user-friendly software, QGGSMS™.NET, which is capable of predicting macroscopic mechanical properties such as Young's modulus, Poisson's ratio, etc. of shales or shaly rocks providing the mineral composition and porosity.
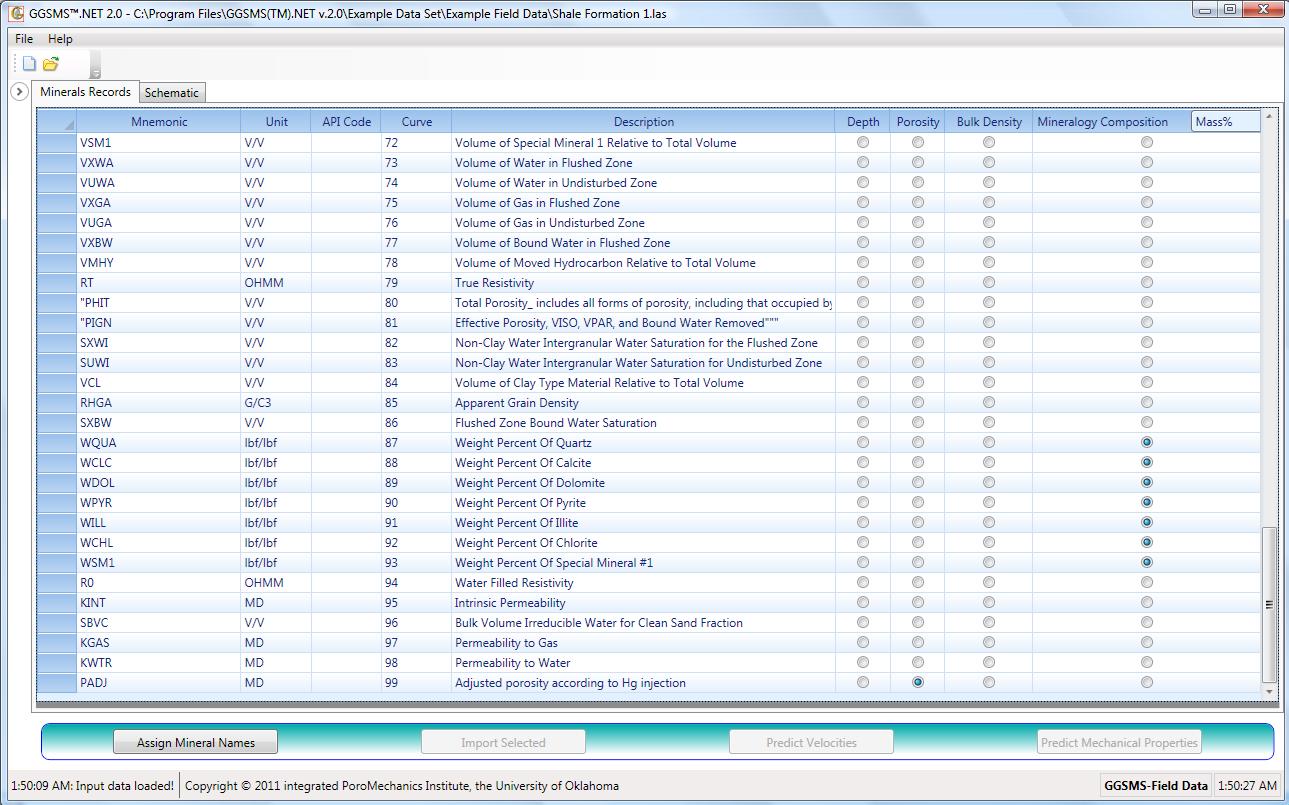
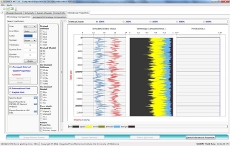
To meet field application demands, the software allows direct importing of log data for real-time onsite prediction of mechanical characteristics of shaly formations. To cope with the unavoidable uncertainties associated with log measurements,
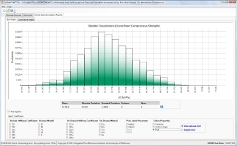
QGGSMS™.NET provides uncertainty simulation for the obtained results utilizing Monte Carlo method.
|
Features
- Import LAS log data.
- Give the mechanical properties of formation in a virtual format.
- Perform uncertainty analysis for selected intervals.
Input for Uncertainties Analysis |
Monte Carlo Simulation Result |
 |
 |
Directly Import Log Data from LAS File |
Predicted Mechanical Properties |
|
 |
| |
(Click
images for enlarged view) |
|
|
|
|
|
|
|
|
|